There are times when a chart looks so extended that every instinct says, “This has to pull back soon.” Gold gave that exact feeling through much of October. It moved fast and it barely paused. Every dip was small and short-lived. And if you were looking at any typical momentum indicator (like the RSI), you’d have seen the same message repeating: overbought.
Silver has spent more than a decade living under a heavy ceiling. It has had a long-term descending trendline that stretches all the way back to the post–financial crisis era. Every attempt to break out since 2008 has been rejected at the same sloping resistance.
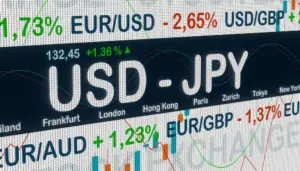
For two years, the dollar’s climb against the yen has been one of the biggest stories in FX, powered by a yawning interest-rate gap between the US and Japan. That gap made shorting the yen almost a no-brainer. But now, things feel… different. The pair is pressing against multi-decade highs, volatility is ticking up, and Tokyo is sounding more urgent. It’s the kind of moment where traders pause and ask: Is this the top?
After dominating global markets for over a year, the US dollar has quietly slipped from its recent peak. The DXY index is easing: a stronger dollar had been tightening liquidity worldwide, while a softer dollar breathes life into stocks, commodities and emerging markets (and that’s something we’ve seen this year).
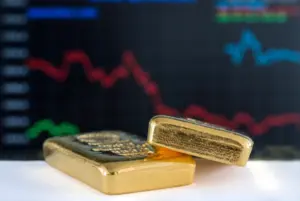
Gold has dazzled the headlines again. This year it surged to fresh records, helped by hopes of Fed rate cuts and a wave of central-bank buying. Investors chasing safety have poured into gold ETFs and bars, enthralled by its glow. And silver, gold’s quieter, industrial sibling, sits in the shadows. But ask yourself this.. What if the market’s been watching the wrong metal?