November Seasonality: Do Indices Really Rally?
Why does November always get the benefit of the doubt? Is it a genuine market edge, or just a calendar-based placebo traders use when fundamentals go quiet? Historically, major stock indices often climb in November. Data shows that since 1950 November has been the strongest month for stock market returns, and November-December the best two-month stretch on average. So when seasonality charts come out, it’s fair to wonder: is the holiday rally still baked in? Or is this year different?
Seasonality: Pattern or Placebo?
The seasonality argument is hard to ignore. Analysts point out that on average the S&P 500, Nasdaq and FTSE 100 tend to finish November in the green. Some studies show a nearly 80-90% “bullish success rate” for Novembers. But reality has big exceptions. Remember 2008, when the S&P fell? Or 2022’s late-year slump? These remind us “average November” doesn’t guarantee a win.
Today’s markets are driven by algo and quant strategies far more than in decades past. When conviction is low, seasonality stories gain traction – something to cling to when news fails to inspire! But is it a crutch? A cue? We see both sides: the data hint at a historical edge, yet statistically benign months can still disappoint. Treat seasonality as a prompt for discussion, not a sure thing.
November’s Edge in Context: A Century of Monthly Returns
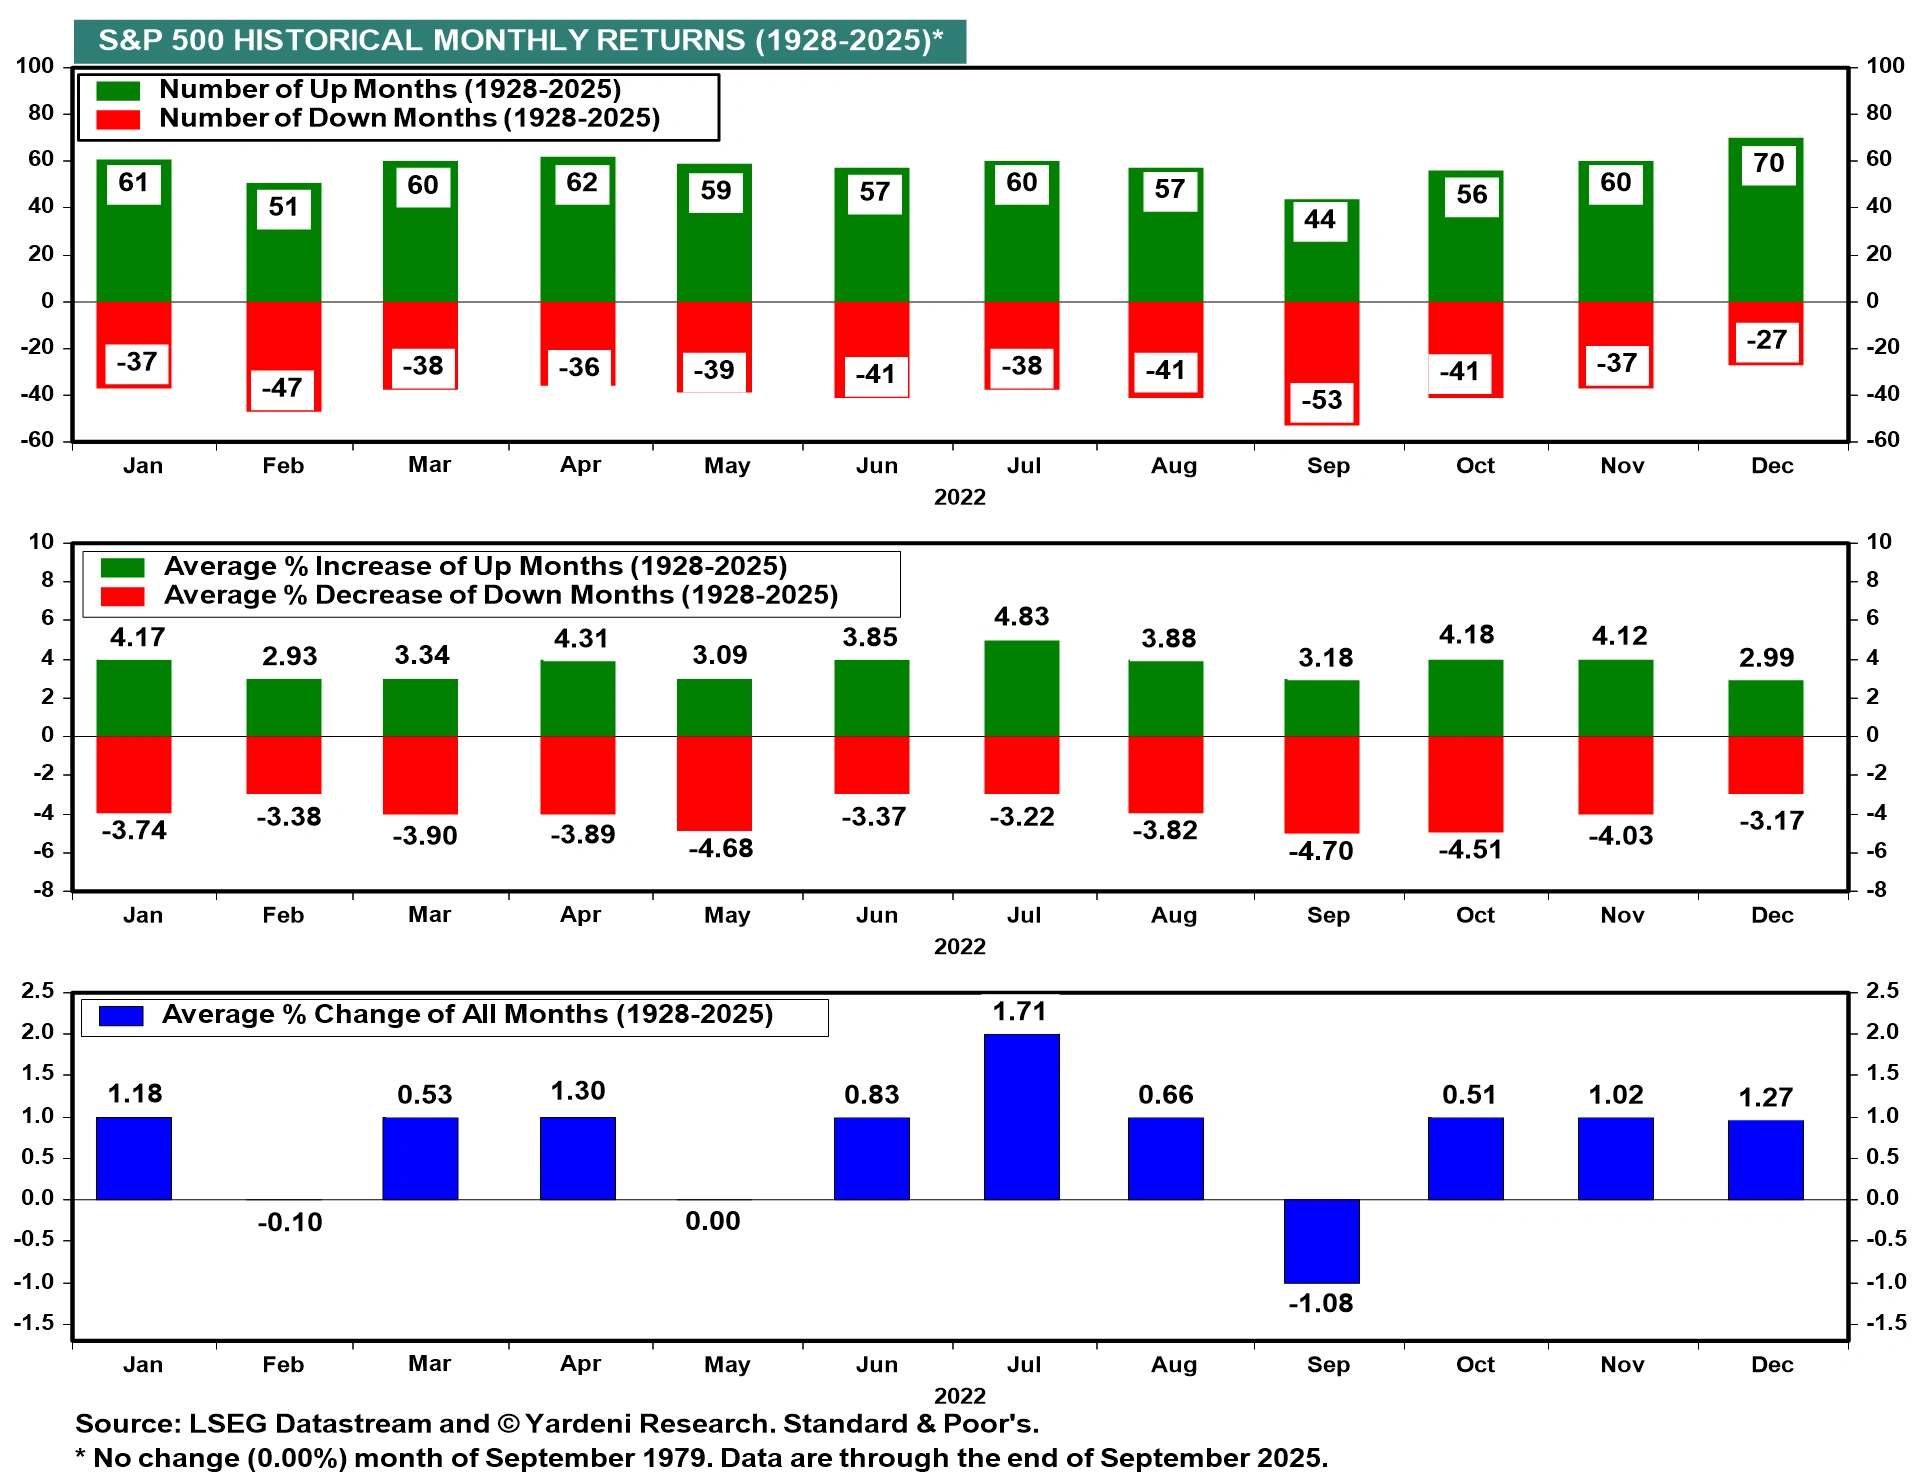
Source: LSEG Datastream, Yardeni Research. Standard & Poor’s. All indices are total return in US dollars. Past performance is not a reliable indicator of future performance. Data as of 22 July 2025.
Across nearly a century of data (1928-2025), November ranks among the most consistently positive months for the S&P 500 – 60 up months versus 37 down. Average November gains (+4.12%) are outpaced only by July. Still, history doesn’t guarantee future outcomes.
Chart Setup: Are We Setting Up for a Rally or a Trap?
Looking at the charts, the story is mixed. By late October 2025, all three major US indices were hitting record highs – bulls might say momentum points to more gains. On the S&P 500 daily chart, prices are above the 200-day moving average (around 6,700), which signals an uptrend.
Yet the recent rebound from October’s lows leaves traders wary. After a sharp sell-off, October’s quick bounce has pushed the S&P into overbought territory. Technical gauges hint at potential exhaustion: the S&P’s 14-day RSI is around 73, which usually means “overbought.” Are dip-buyers still lying in wait near support (like the 50- or 200-day lines)? Or has the market run too far, too fast? It’s plausible we’re “bouncing into November,” but this could be a bear trap. The charts show strength but also signs of being stretched. Traders will watch key levels to see if price action validates or snaps the seasonal narrative.
S&P 500: Rally or Exhaustion?
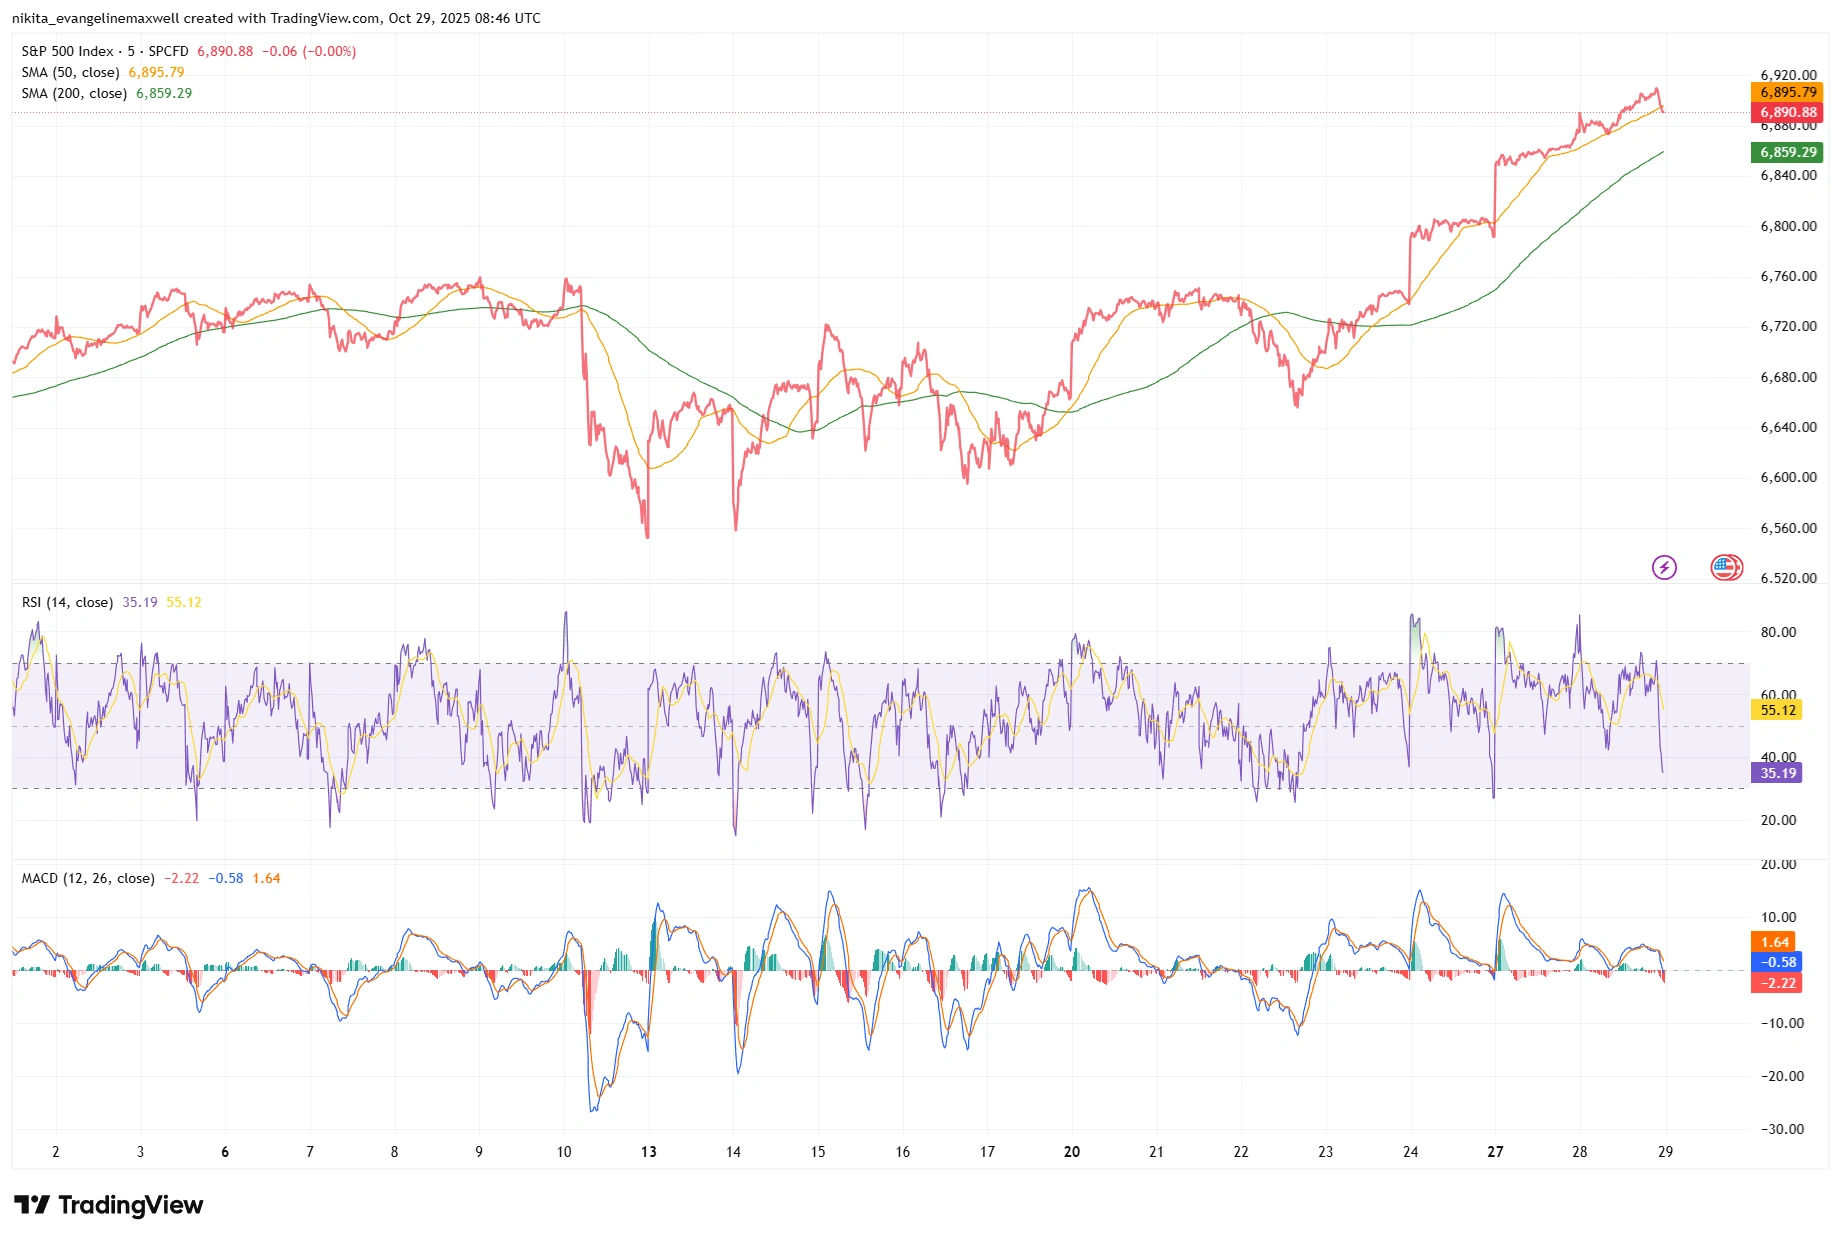
Source: TradingView. All indices are total return in US dollars. Past performance is not a reliable indicator of future performance. Data as of 29 October 2025.
The S&P 500 climbs into late October 2025, holding above key moving averages. RSI previously signalled overbought territory, hinting at stretched momentum. Is the rally cooling, or setting up for another leg higher?
The Psychological Layer
Markets often go on narratives, and “November rally” is a catchy one. If many expect a holiday bounce, they might buy to be part of it – which can make the rally happen. Citadel’s data suggest retail investors are brimming with confidence: net buyers in 23 of the last 27 weeks, even buying dips. In contrast, large institutions have been more cautious. The crowd could already be leaning long, anticipating seasonality, while pros remain sceptical. Are we reading a chart, or just reenacting last year’s playbook?
Positioning can invert price moves. If too many pile into “long November” trades, the market could be vulnerable to a surprise. Pause: do you believe in the pattern, or are you following the herd? A bullish narrative fuelled by low conviction can be the setup for a selloff. This tug-of-war – hope vs. caution – often becomes the driver around turning points.
Risks & Catalysts
Beyond charts and sentiment, events can flip the script. November brings US inflation data and the jobs report, along with a Fed meeting. In the UK, BoE and inflation figures arrive too. Any shock in these readings could undercut seasonal calm.
Geopolitics, elections, and an OPEC oil decision could sway sentiment. If the crowd assumes “November means rally,” a news surprise might catch it off guard. On the flip side, signs that inflation is peaking or rate hikes ending could fuel buying. In 2025, the baton of movement could pass to earnings cuts or growth fears, rather than the calendar.
Bottom Line
Seasonality might be a helpful map, but it’s not the territory. History says November tends to rise, but in markets like these, history doesn’t always rhyme. Instead of following the page, it pays to watch price and reaction. See how the market behaves when old patterns meet new conditions. That’s the real clue!