Gold Price Drop Analysis: Is This a Correction or Trend Reversal?
Gold’s price, tracked on the gold price chart, just plunged sharply over Monday-Tuesday, erasing the past week’s gains and stirring up real volatility. The gold price dropped roughly 6% over those two sessions – the biggest one-day fall in over a decade – and it came with no obvious news trigger. Investors suddenly find themselves asking: after nine straight weeks of gains, was this a routine profit-taking pullback or the first hint of something more serious in the gold market analysis?
Gold Technical Analysis: Key Drivers Behind the Price Drop
Gold testing key support after two-day slide (as of Oct 21 2025). The daily gold price chart shows gold retreating from recent record highs (around $4,380) back toward its old support zone near $4,100-$4,200. In the lead-up, gold price had carved out higher highs on a well-defined uptrend line, staying above all of its medium/long-term moving averages (21-, 50- and 200-day MAs all sloping up). Traders note that key technical support lies near the October 14 low (~$4,095) and the prior October 20 area (around $4,190).
By contrast, momentum indicators were already flashing caution. The daily 14-day RSI had been perched in the low 80s (well above the usual 70 overbought line) and the MACD was extended high – classic signs of an overstretched rally in gold trading. In other words, bulls were short on steam. When the sell-off hit, it came on heavy volume – led in large part by gold ETFs – as longs hit their stops. That technical setup (extreme RSI/MACD readings plus a record-long rally) meant a sharp corrective leg was quite plausible once profit-taking kicked in.
Gold Testing Support After Sharp Pullback
(Based on current forex gold trading and live gold trade signals.)
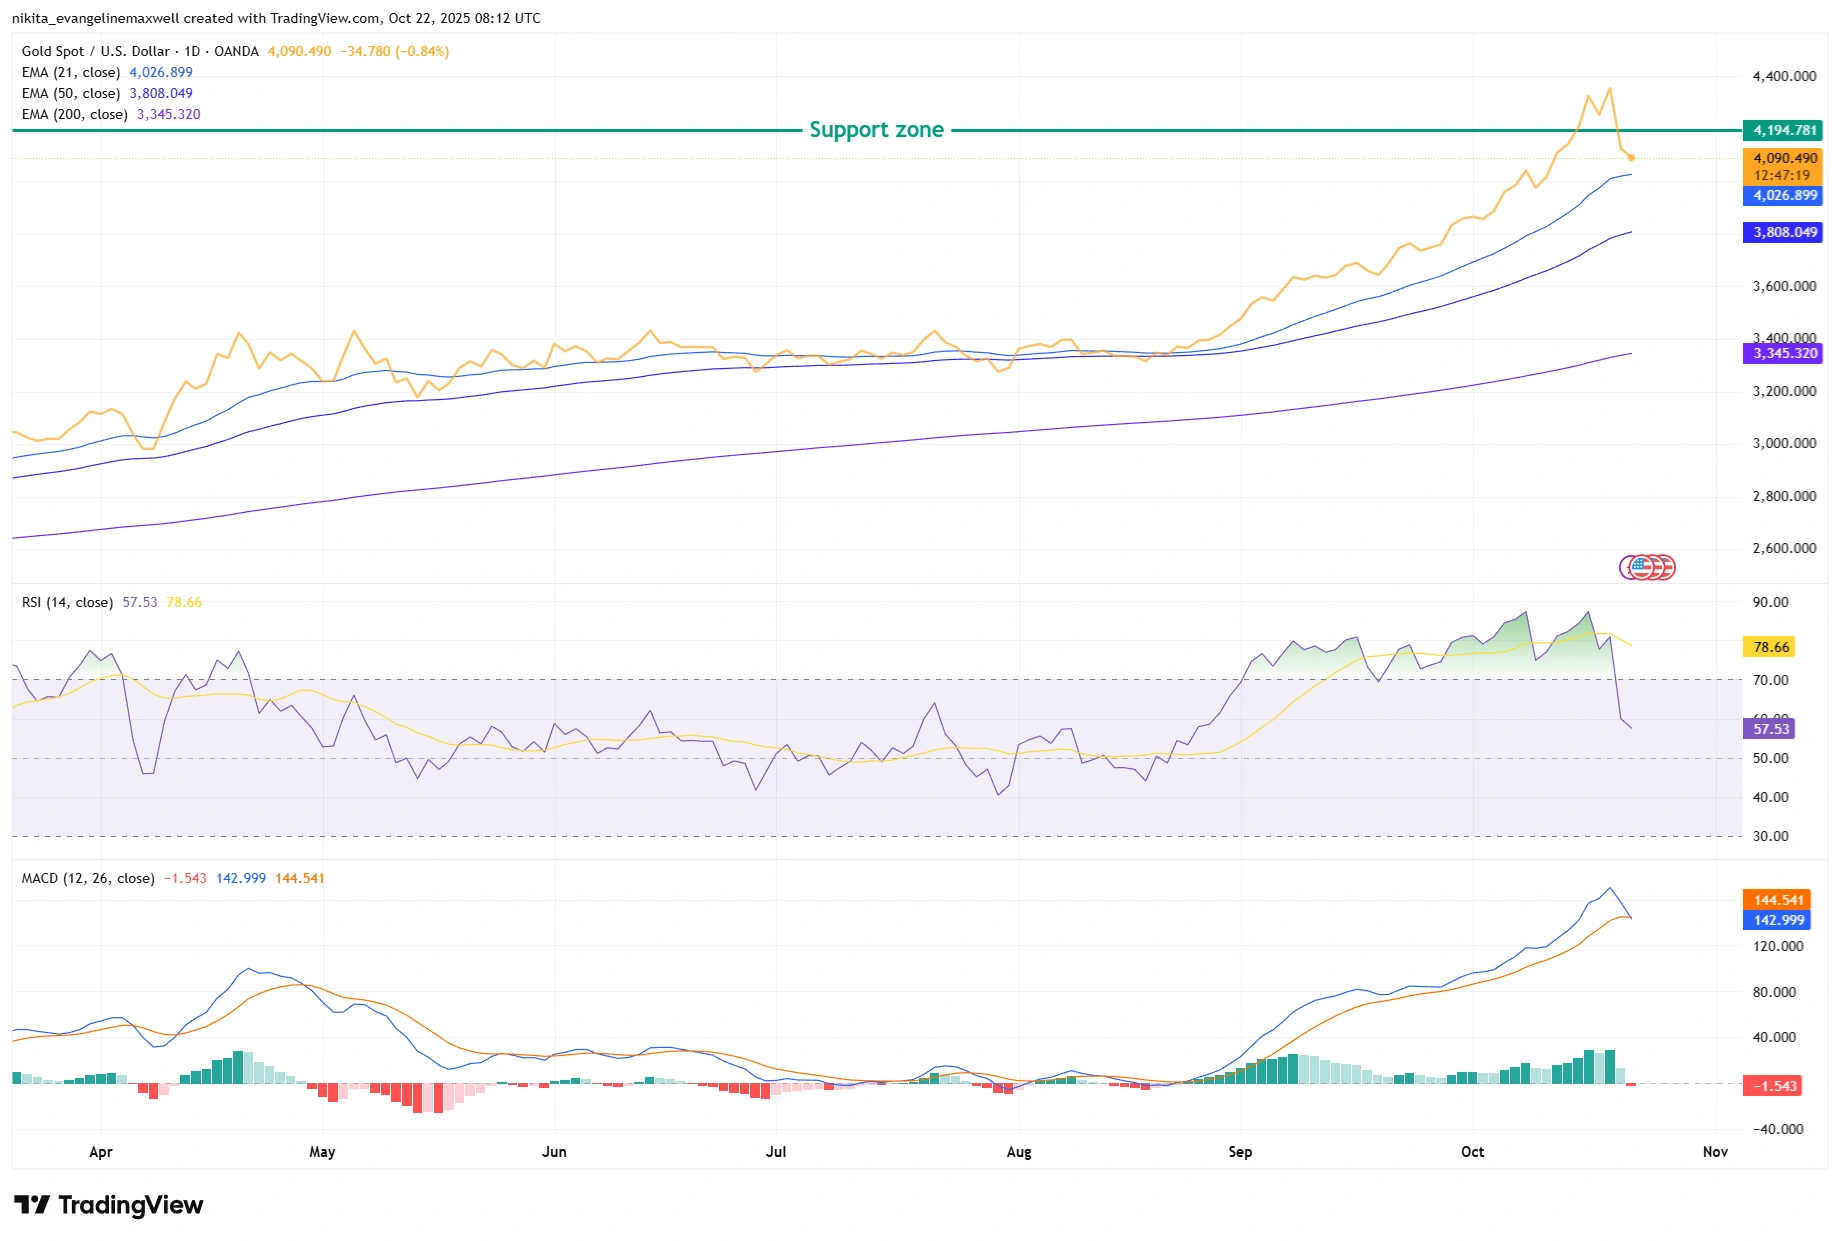
Source: TradingView. All indices are total return in US dollars. Past performance is not a reliable indicator of future performance. Data as of 22 October 2025.
Gold pulls back from record highs as momentum cools. RSI falls from overbought, MACD weakens, and price nears key moving average support.
Gold Price Momentum and Chart Patterns: What Traders Should Watch
Gold consolidating below recent highs as buyers test short-term trend support. Zooming into a shorter timeframe, the picture looks like a brief pullback inside an overall uptrend. Buyers stepped back and price has been caught in a tug-of-war around the mid-$4,200s. This is crucial for traders watching how to trade gold and checking what is the latest price of gold.
All eyes now are on how this pause resolves. A sustained break below roughly $4,190 (Tuesday’s low) would confirm the correction, likely dragging gold toward the ~$4,095 area and then the $4,000 “round” level. On the other hand, a clean reclaim of the mid-$4,300s would swing momentum back to the bulls. To the upside, the all-time high near $4,380 (and even the $4,400-$4,450 zone) will cap any bounce.
In short, watch those swing levels: holding above $4,200-$4,250 would let bulls breathe easier, but only a push through the prior $4,380 peak would convincingly signal a resumed uptrend. This zone is key for traders learning how to trade gold, tracking live gold trade activity, and verifying what is the price of gold today and what is the latest price of gold.
Gold Trading Risks and Market Factors to Watch This Week
Any stronger-than-expected US economic data (keeping Treasury yields and the dollar firm) could put fresh pressure on gold. The calendar looms with key events: Friday’s October US CPI report and upcoming payroll numbers, plus the Fed’s October 29 policy meeting. If inflation remains sticky or Fed speakers turn hawkish, we’d likely see gold struggle.
Conversely, a soft CPI print or dovish Fed comments could entice buyers back in. Traders will also be mindful of any dollar moves or geopolitical shifts (and even Asian physical demand trends) that could tip the balance one way or the other. In any case, the picture can change quickly, so staying nimble is crucial. Monitoring trading central gold, gold trading charts, forex gold trading, and live gold trade flows can help traders stay aligned with market momentum.
Bottom Line
There’s no crystal ball in trading: gold will need to prove its next move at clearly drawn lines in the sand.
As it stands, holding above roughly $4,190 and bouncing off there would keep the door open for bulls, while a decisive break below that into the $4,100s would undermine the recent rally.
On the upside, regaining the mid-$4,300 area (and especially a fresh move above ~$4,380) would signal that the pullback was temporary.
Traders will be watching how gold price, gold trading, and live gold trade levels behave around those zones – that reaction will tell us whether this was just a healthy correction or the start of something more, reflecting the described gold chart patterns and indicators in gold market analysis.
Want to understand why traders turn to gold during market stress?
Read our in-depth guide Safe-Haven Assets Explained: When Investors Flock to Gold, Yen, and USD for insights into how safe-haven flows shape gold demand.
Gold Price Analysis FAQs
Why did the gold price drop suddenly this week?
Gold prices fell sharply due to profit-taking after a record nine-week rally. Technical indicators like RSI and MACD showed overbought conditions, triggering a wave of selling once prices broke key support levels. The move wasn’t tied to a major news event but rather a natural correction after strong momentum.
Is this gold price drop a correction or the start of a bigger trend reversal?
At this stage, it looks more like a correction than a full reversal. Gold remains in a broader uptrend as long as it holds above key support near $4,190–$4,100. A sustained move below those levels could, however, signal a deeper shift in market sentiment.
What technical levels should gold traders watch right now?
Traders are closely watching support near $4,190 and $4,095 and resistance around $4,300–$4,380. A break below support could extend the decline, while a push above $4,380 would confirm that buyers are back in control.
How do economic data and the Federal Reserve affect gold prices?
Stronger U.S. data or hawkish Fed signals typically pressure gold because they lift Treasury yields and the dollar. Conversely, soft inflation or dovish Fed commentary often boost gold as traders anticipate lower rates or rising safe-haven demand.
Is gold still a good safe-haven asset?
Yes! Gold remains a core safe-haven asset, especially during financial uncertainty or geopolitical risk. However, short-term volatility and technical pullbacks are normal even in longer-term bullish trends.